Business travel KPIs measure four things: what trips cost, how well the travel policy is followed, their carbon impact and the traveler experience. Twelve metrics are enough to run a travel program, as long as the data comes from a single source.
This article brings them together in one table: definition, formula, data source and benchmark. It then offers a sample dashboard, ready to share with finance, HR and the sustainability team.
About the benchmarks. Figures come from aggregated, published Fairjungle data. When no aggregated data can put a number on a metric, the benchmark shows the direction to aim for. Your own history remains your best reference.
The 12 business travel KPIs in one table
The metrics fall into four families: costs (1 to 4), compliance and behavior (5 to 8), carbon impact (9 and 10), traveler experience (11 and 12).
How to read each family of metrics
Cost KPIs: see where the budget goes
Average cost per trip gives the overall picture. On its own it says little: a trip to Lisbon and a Paris–Lyon return do not have the same normal cost. Break it down by trip type and by team.
The average hotel night rate is often the first item to drift. Compare it with your policy caps and with market prices: our study on business travel hotel prices in Europe gives orders of magnitude by region.
Out-of-policy booking cost puts a number on what exceptions really cost. It is the strongest argument for adjusting a rule or enforcing it. The concrete actions are covered in our article on cutting business travel costs.
Compliance KPIs: check that the policy is applied
The compliance rate and the share of bookings made in the tool go together. 95% compliance on 60% of bookings leaves 40% of the budget out of sight. So start with the share made in the tool.
The advance booking rate and the cancellation rate measure booking behavior. They are managed through clear rules in the travel policy: minimum lead time, allowed fare types, exceptions.
Impact KPIs: measure the carbon footprint
Emissions per trip and rail share are the two most useful sustainability metrics. The first measures the result, the second the action that lowers it fastest.
According to the Fairjungle Carbon Barometer 2024, emissions per traveler rise with company size: up to 30% higher in mid-sized and large companies than in SMEs. Banking and telecoms have the lowest ratios, consulting and industry the highest. This data also feeds non-financial reporting: see our approach to sustainable business travel.
Experience KPIs: keep travelers in the channel
An unhappy traveler books elsewhere. Satisfaction and reimbursement time are therefore leading indicators: they drop before the share of bookings made in the tool does.
Reimbursement time depends mostly on the expense process. Our guide to expense management explains how to shorten it.
Sample business travel dashboard
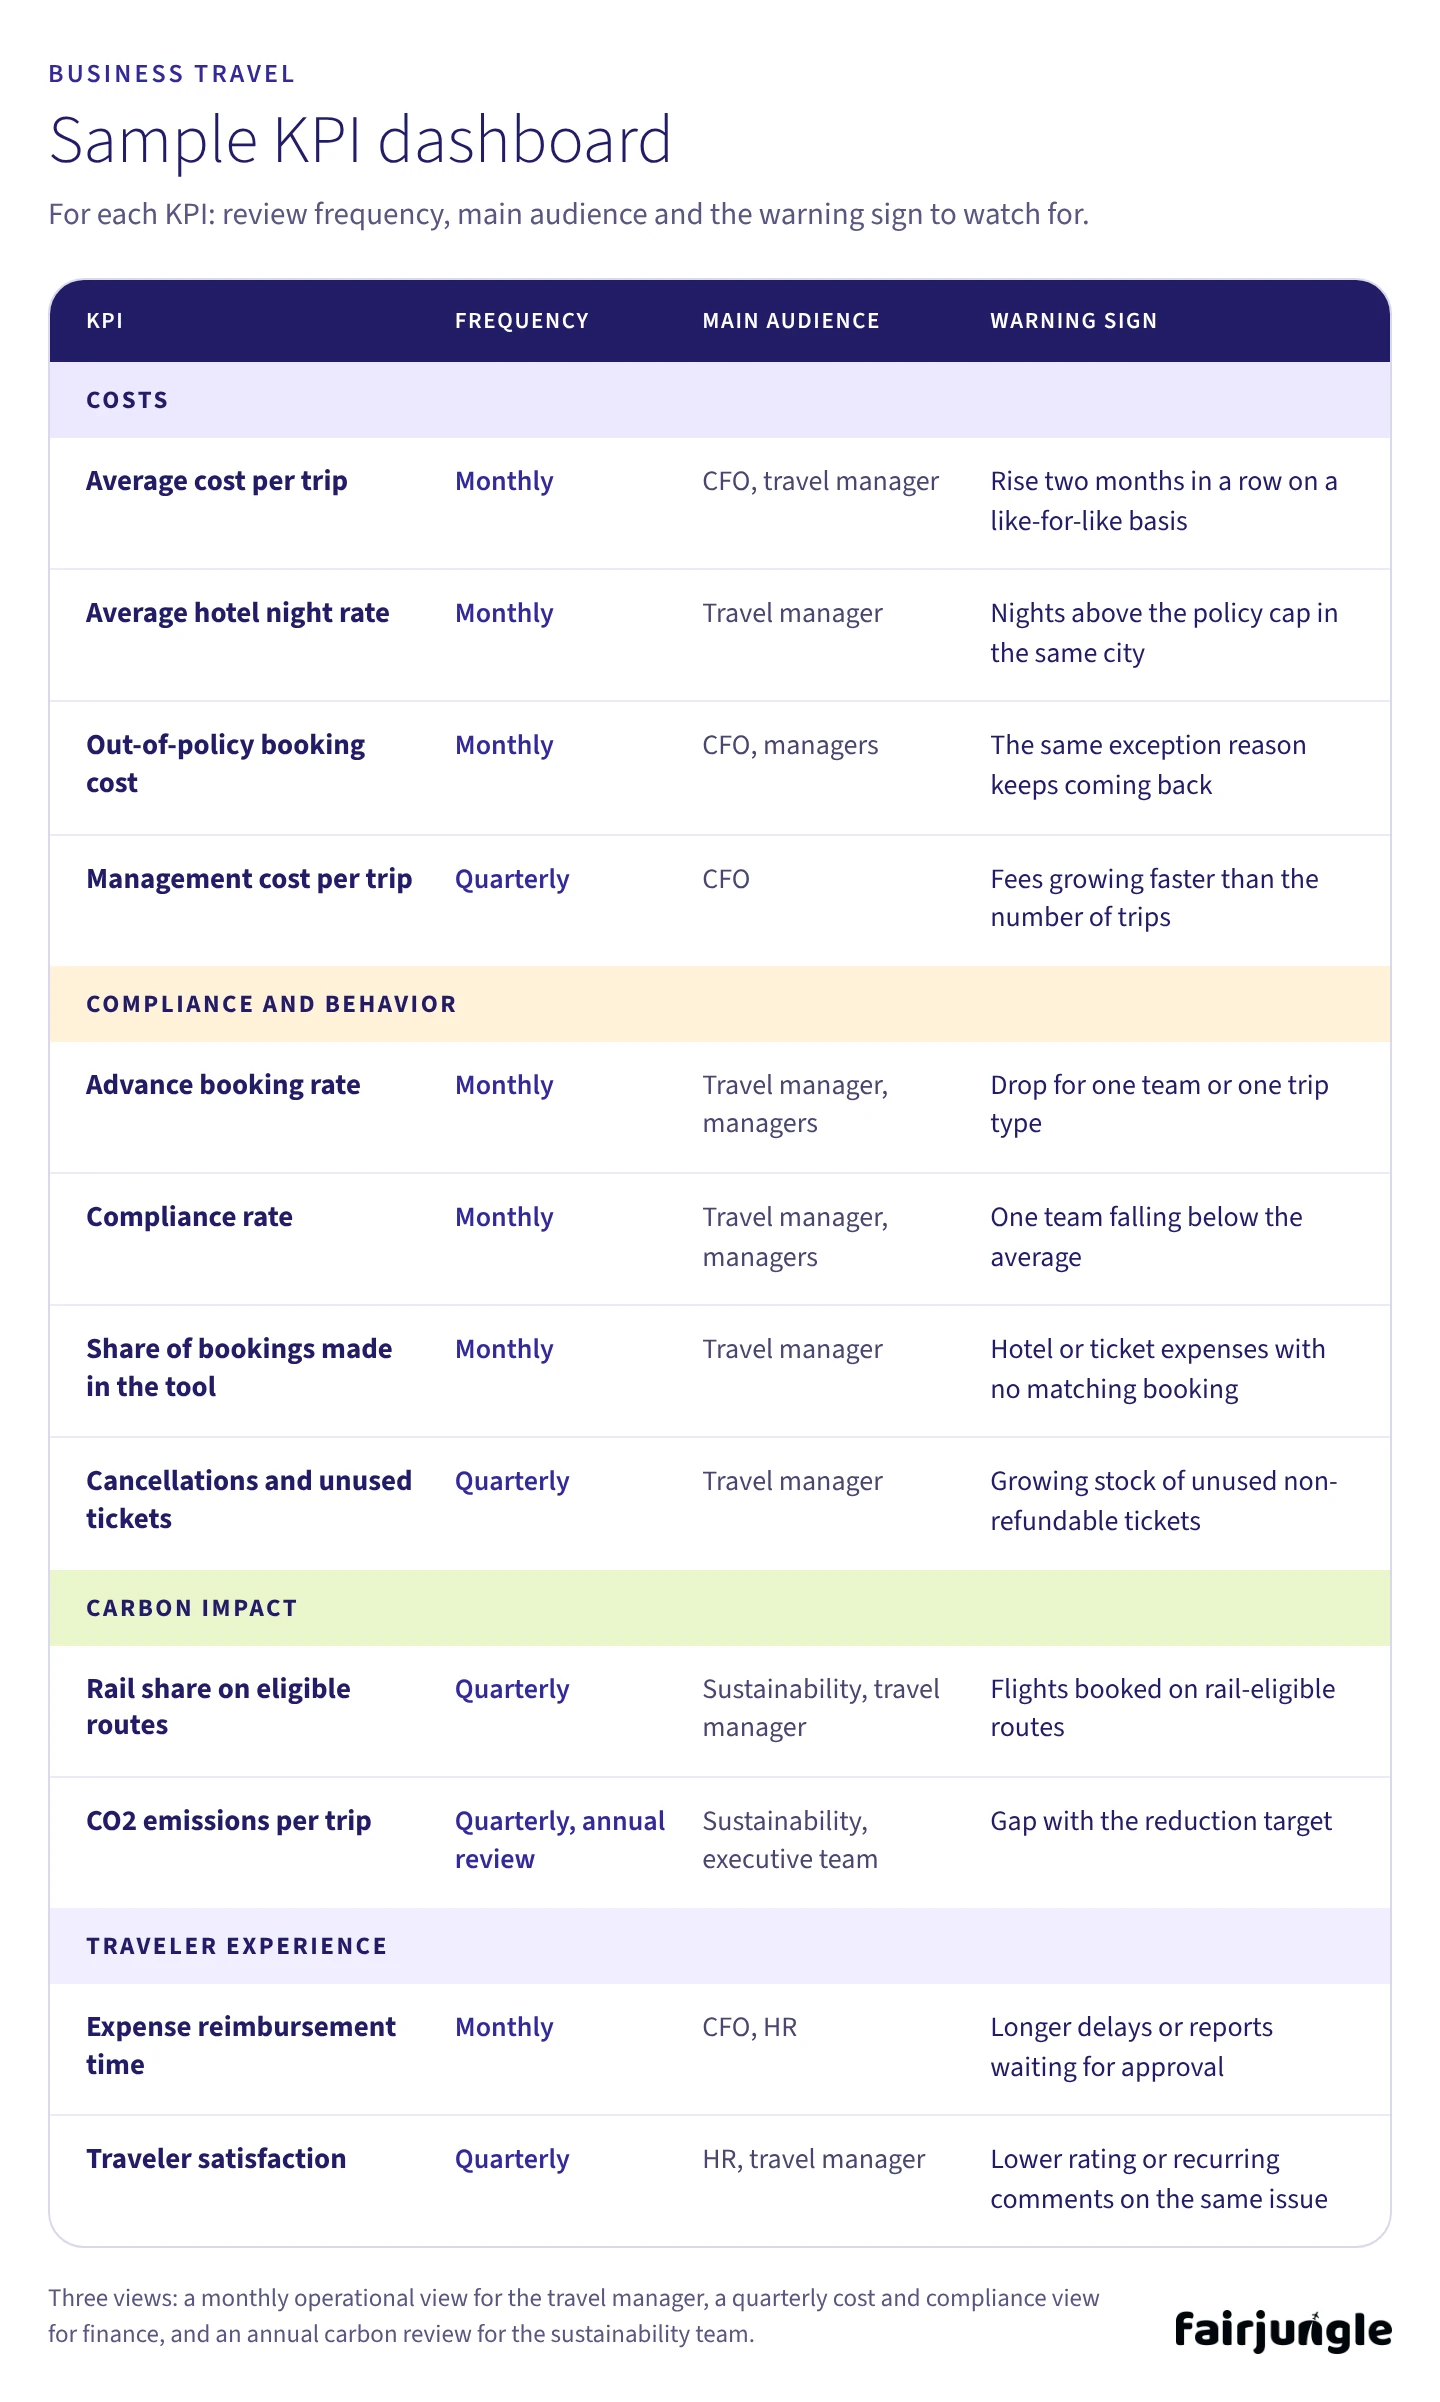
A good dashboard fits on one page: 12 metrics, each with a review frequency and an owner. Here is a template to adapt.
Use three views: a monthly operational view for the travel manager, a quarterly cost and compliance view for finance, and an annual carbon review for the sustainability team.
Set up KPI tracking in 5 steps
Centralize bookings. As long as trips go through several channels, the figures are incomplete. A single booking and travel management tool makes the data usable without reworking it.
Pick 5 or 6 KPIs to start. Average cost per trip, compliance rate, share made in the tool, advance booking rate and emissions per trip cover the essentials. Add the others once these five are reliable.
Measure your starting point. Calculate each metric over the last three to six months. These values, not a market average, are your baseline.
Write the thresholds into the travel policy. Minimum lead time, hotel caps by city, rail eligibility threshold: every KPI needs a clear rule.
Set a regular review. A short monthly review with the travel manager, a quarterly review with finance. Each review ends with one action and its owner.
FAQ
What are the most important business travel KPIs?
Average cost per trip, travel policy compliance rate and share of bookings made in the tool are the three core metrics. Add CO2 emissions per trip if the company has sustainability targets.
How do you calculate the travel policy compliance rate?
Divide the number of compliant bookings by the total number of bookings, then multiply by 100. A booking is compliant if it follows every rule: cap, class, lead time, approval.
How many KPIs should you track?
Five or six to start, twelve at most. Beyond that, the dashboard stops being read and the metrics no longer trigger action.
How often should you track business travel metrics?
Monthly for costs, compliance and share made in the tool. Quarterly for satisfaction, management costs and carbon, with an annual carbon review.
How do you measure the CO2 emissions of a business trip?
Multiply the distance traveled by an emission factor for each mode of transport, taken from references such as ICAO or ADEME. A booking tool with built-in carbon calculation does this for every booking.
How do you track bookings made outside the tool?
Cross-check expense reports and card statements against bookings in the tool. A hotel or ticket expense with no matching booking points to an off-channel booking.
Key takeaways
Twelve KPIs cover the four stakes of business travel: costs, compliance, carbon impact and traveler experience.
The share of bookings made in the tool determines how reliable every other metric is.
Your own history is the best benchmark. Aggregated Fairjungle data gives two orders of magnitude: €120 to €180 per night in major European cities outside France, and 289 kg of CO2 per traveler per year.